Software Development Time Estimation: How Real-Time Data Improves Forecasting
Discover how real-time data transforms software development time estimation.

Engineering forecasts typically fail because your data is incomplete, outdated, or based on estimates. And even with Agile rituals and velocity charts, these estimates can still drift.
The thing is, forecasting depends on real signals from active work. Real-time data connects planning to delivery, which gives you the clarity to set achievable goals, manage cost expectations, and improve trust across teams.
In this article, you’ll see how real-time metrics transform software development time estimation and make forecasting measurable. But first, let’s look at how estimation actually works before automation changes the picture.
P.S. See how Chrono platform automatically tracks engineering activity from Jira, Git, and calendars so your forecasts reflect real progress.
What Is Software Development Time Estimation?
Software development time estimation means predicting how long engineering tasks or projects will take to complete based on available data and constraints. In simple terms, it’s how you translate engineering scope into measurable timelines that finance, operations, and delivery teams can trust.
Accurate estimation lets you plan releases, allocate resources, and forecast costs with more control. But many teams still depend on manual estimates that rarely hold up in practice.
And that can lead to many problems.
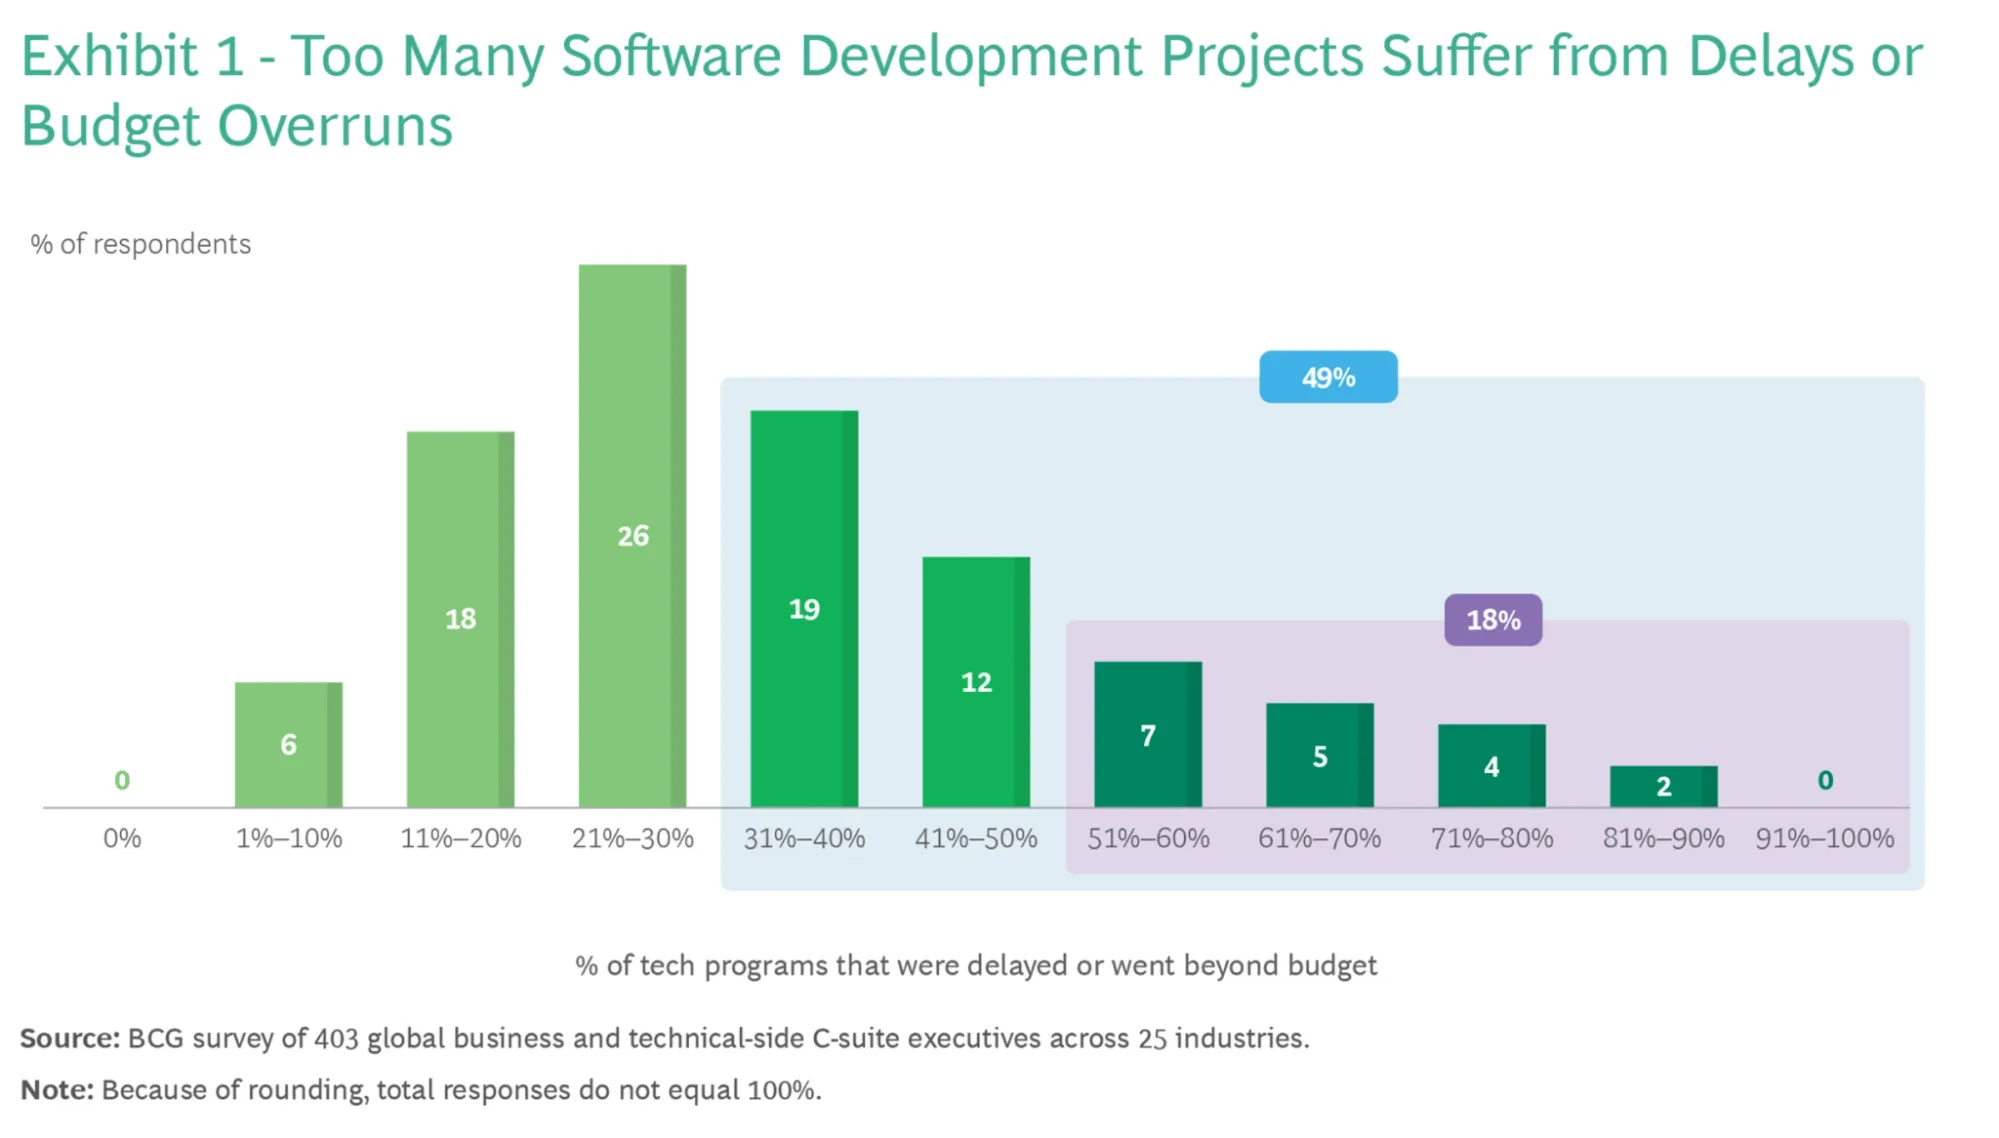
For example, nearly half of respondents in a global survey by Boston Consulting Group (BCG) said over 30% of their internal software projects ran late and over budget.
Every missed estimate erodes both trust and predictability, but better forecasting helps you avoid that.
Software Development Time Estimation Formula
Here’s the standard formula engineers use to calculate an estimate:
Estimated Time = (Optimistic Time + 4 × Most Likely Time + Pessimistic Time) ÷ 6
This is the three-point estimation method, also called the PERT formula. It gives you a balanced view by weighing the best, realistic, and worst-case scenarios.
Software Development Time Estimation Example
Let’s say your team needs to build an internal API. The optimistic estimate is 5 days, the most likely is 8, and the pessimistic is 14. So, plug these into the formula and you get: (5 + 4×8 + 14) ÷ 6 = 8.5 days.
That number gives you a statistically weighted estimate for planning. But here’s the thing: static formulas ignore actual workflow data like context switching, meeting time, and review delays. And that’s where modern platforms change the game.
But first, let’s see how different estimation methods stack up and where they start to fail.
Software Development Time Estimation Methods
Engineering teams use a few common methods to estimate timelines, each with different strengths and limitations.
Here are the most common approaches:
- Top-down: Senior leaders define timelines based on strategic goals or budget constraints. It’s fast but typically detached from actual development capacity.
- Bottom-up: Individual contributors estimate each task, and results roll up into a full project forecast. It’s detailed but time-consuming.
- Story-point-based: Teams assign relative effort values to tasks, using past sprints to predict velocity. Accuracy depends heavily on consistent calibration.
- Analogous: Uses data from similar past projects as reference points. It works best when historical data is clean and comparable, and when the team composition is similar.
- Three-point: Balances optimistic, likely, and pessimistic outcomes to manage uncertainty. It’s useful for risk-adjusted planning.
- Parametric estimation: Uses known productivity rates (like cost per feature or hours per story point) multiplied by size/complexity to scale predictions.
- Expert judgment: Relies on senior engineers or architects to define estimates based on domain experience. Effective in smaller setups, but prone to personal bias and breaks at scale.
- 40-20-40 rule (heuristic): Allocates 40% of time for development, 20% for testing, and 40% for integration and rework. This aligns better with real delivery patterns in some teams. However, it comes from older project-management heuristics (especially in embedded systems and enterprise apps), and is more of a Planning Fallacy countermeasure. As such, it is NOT widely used in modern software engineering.
You can check out this YouTube video to learn how to estimate software development time:
Lesson learned: Each approach offers insight, but none fully accounts for real-time data shifts. So, let’s continue by discussing why traditional methods break down once projects start to move.
The Problem with Traditional Time Estimation Methods in Software Development
Most traditional approaches to estimating software development time rely on manual data entry, subjective guesses, or outdated velocity charts. They assume that people work in straight lines, with consistent focus and no interruptions.
But the reality is far messier.
Manual inputs usually go stale fast, and disconnected tools create blind spots that make delivery forecasts drift with every sprint. According to PPM Express, more than 38% of employees who track time still use paper cards or physical clocks.
Manual systems like these create lag between what’s happening in real work and what’s reflected in reports. That lag hides the real pace of progress, especially when projects scale across multiple teams or time zones.
These blind spots create predictable problems:
- Lack of visibility into actual hours spent compared to planned effort. Forecasts look clean on paper but fall apart under real-time execution.
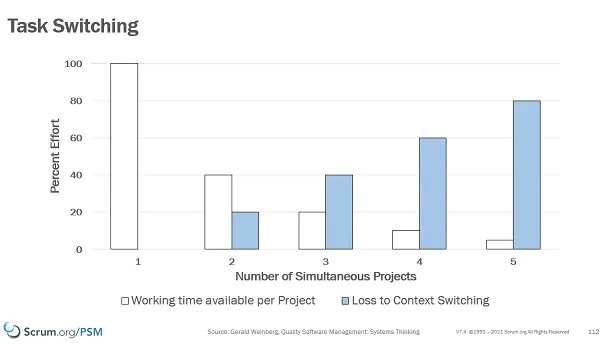
- Context switching and hidden rework go untracked. As Gerald Weinberg’s research showed, working on two projects doesn’t split time 50/50, but it cuts productivity by about 20%. That gap compounds across teams.
- Non-project time, like meetings, code reviews, and ad-hoc fixes, never appear in static spreadsheets. The result is false confidence in capacity.
Over time, these gaps lead teams to overcommit and miss deadlines even with careful planning.
So, what’s the fix?
Well, let’s see why automating your estimation process changes everything.
Why Estimate Software Development Time Automatically?
To estimate software development time accurately, you need consistent, unbiased data and that’s exactly what automation provides. Manual inputs and human judgment just can’t keep up with modern engineering velocity. But automated systems can capture what’s actually happening and then give you a factual baseline for planning, budgeting, and forecasting.
And there’s another thing to consider.
Time estimates usually fail because they depend on perception rather than evidence.
For example, in one randomized controlled trial, developers using AI assistants worked 19% slower, even though they felt 20% faster. That gap shows how subjective impressions distort predictability.
Automation can help you close that gap by replacing “how it felt” with “what the data shows.”
Set Realistic Timelines with Objective Data
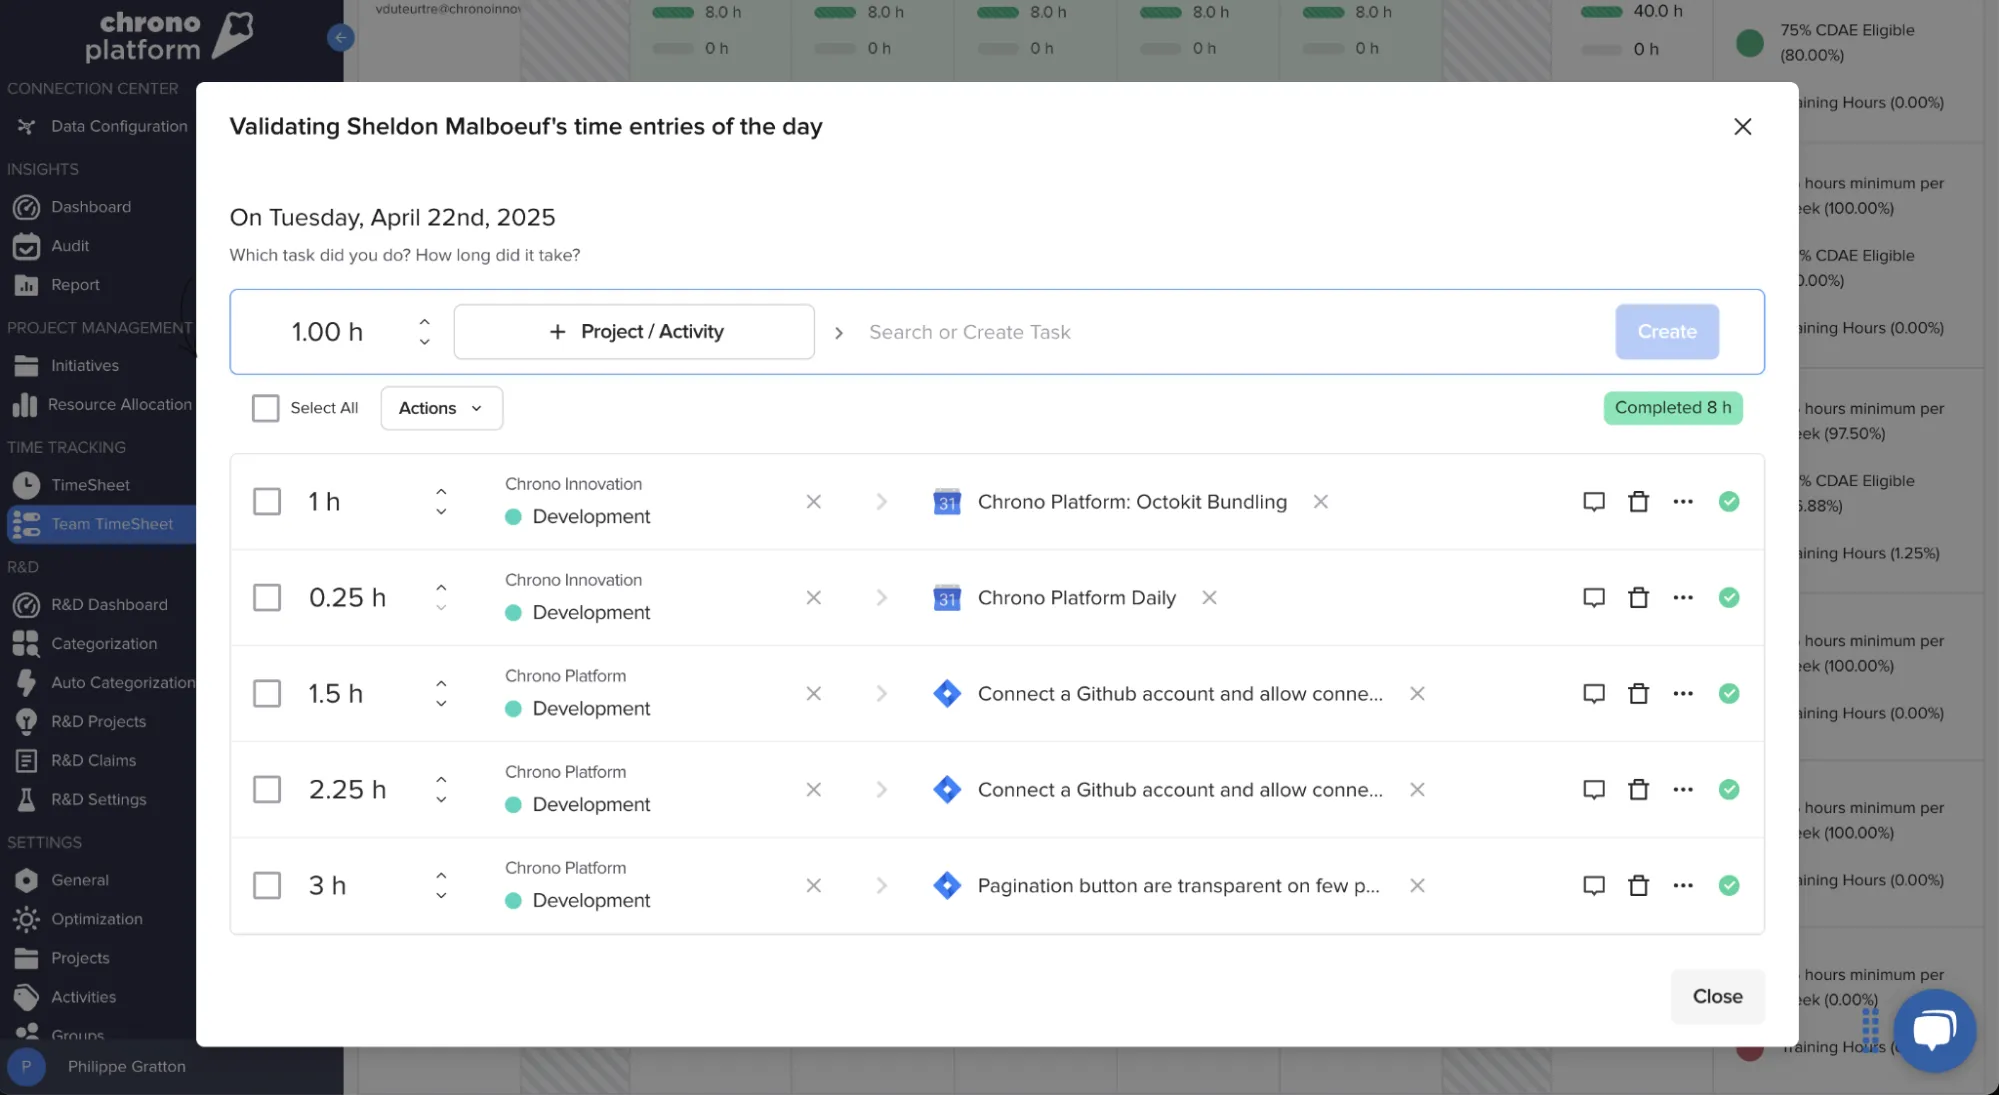
Automated software development time tracking from Chrono Platform connects directly to your workflow tools like Jira, Git, and Google or Outlook calendars.
Instead of asking developers to log time, platforms such as Chrono pull real activity data through APIs. Also, ticket updates, commit events, and calendar blocks merge to reconstruct how long real work takes.
This process removes bias and creates an objective timeline for delivery.
When you know exactly how long features, bug fixes, or rework actually take, your forecasts stop being wishful thinking. And because this data updates continuously, you’re planning based on current behavior rather than outdated assumptions.
Align Budgets and Forecasts Across Teams
Finance, product, and engineering typically speak different time languages.
But automated data bridges that divide.
Chrono Platform’s real-time feed allows finance teams to align cost projections with actual effort. This helps you build predictable models for capacity and cost-per-sprint, which leads to better resource planning and budget control.
It also builds credibility with stakeholders.
Clear progress reports based on real metrics replace subjective updates like “on track.” That transparency improves trust, especially when leadership depends on your forecasts for investment decisions.
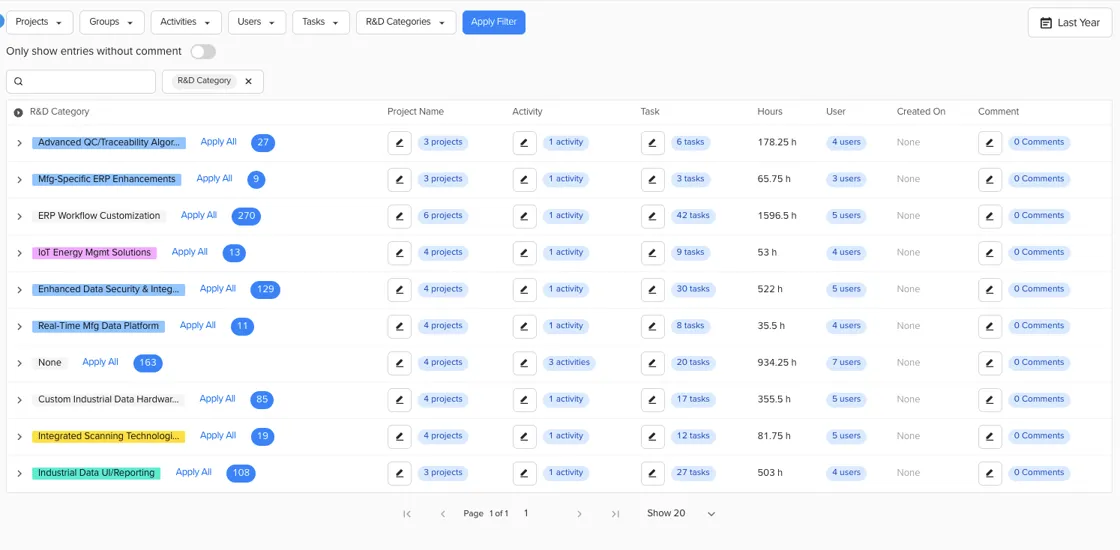
Support Audit and R&D Requirements
Chrono Platform’s system goes beyond forecasting. Its automatic categorization of engineering time (features, debt, toil, and meetings) makes data audit-ready. This is important for SR&ED or R&D documentation where precise work records are mandatory.
And because Chrono Platform reconstructs time from connected tools, it allows you to reverse-engineer how effort was spent without manual logging.
When automation takes over the repetitive part of estimation, you regain clarity on where time really goes and where future risks lie.
So let’s move on to which key metrics matter most for accurate forecasting.
Key Metrics to Estimate Software Development Time
Accurate forecasting starts with the right metrics. This means spotting the patterns that define your team’s delivery pace, predictability, and capacity rather than counting every minute. Here are the core metrics that matter when refining your time and material software development forecasts.
Cycle Time & Throughput
Cycle time in software development measures how long it takes for work to move from “in progress” to “done.” The average across good teams is about seven days, according to Pier-Luc Rodrigue, General Manager at Axify. However, he admits that this average varies with task size and complexity. Also, shorter cycle times usually mean fewer blockers and better flow efficiency.
Throughput complements this by counting how many tasks are completed in a set period. Together, these metrics reveal your team’s real delivery pace instead of just what’s planned on paper.
Delivery Predictability Score
The delivery predictability score compares what you commit to versus what you actually deliver. High predictability means your planning aligns with real output.
When it drops, it signals overcommitment or hidden delays. So, monitoring this score helps you identify early warning signs before missed deadlines pile up.
Engineering Time Allocation (Feature/Debt/Toil)
Tracking how time splits across work types exposes effort distribution. On average, engineering teams spend around 21% of their time on maintenance and failure-demand work.
Unfortunately, that’s more than what they spend on developing new features or platform globalization.
Knowing these benchmarks helps you rebalance your own priorities to ensure innovation doesn’t stall under operational load.
Non-Project Time (NPT) Rate
This measures the percentage of hours spent on unplanned or low-value work, like meetings or interruptions. Teams typically lose about 23% of productive capacity here. When you quantify it, then you can see where automation or process tweaks might recover lost time.
Historical Capacity Trends
Past data shows how much work your teams can handle sustainably over time. Recognizing these trends lets you plan future sprints with realistic limits.
How to Estimate Software Development Time [with Chrono Platform]
Accurate forecasting starts with reliable data. And the thing is, you can’t refine what you can’t measure.
As we mentioned above, Chrono Platform gives you the full picture by combining activity from Jira, Git, and calendars into one structured view so you can make data-backed predictions.
Here’s how the process works in practice.
Pull Historical Data from Chrono Platform (Velocity, Team Workload, Delivery Risk)
Chrono Platform aggregates your delivery history automatically, which includes commits, ticket progress, meeting time, and release cadence. This baseline shows how fast your teams actually deliver, how workload has shifted over time, and where delivery risks appear.
You can spot patterns such as declining throughput or overloaded contributors before they distort future estimates. That data gives you a factual starting point for your next plan instead of relying on memory or static reports.
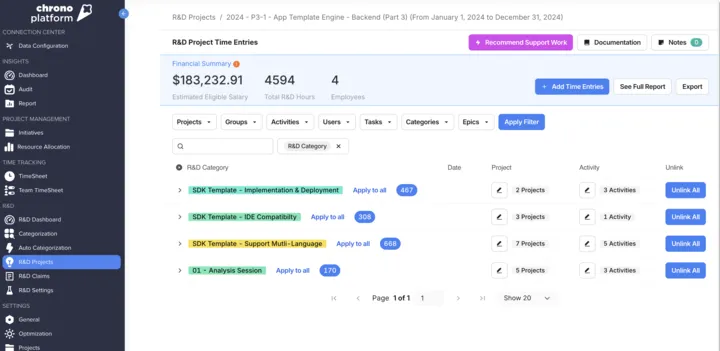
Review Time Allocation by Project Type (Features, Bugs, Maintenance)
Once you have the historical context, the next step is to see where your time truly goes. Chrono Platform automatically classifies effort into categories like features, debt, toil, or meetings.
You can review, for example, that 25% of past sprints went to maintenance work rather than new feature delivery. That clarity helps you forecast future capacity based on actual work distribution. Or, you can decide to implement changes that will shift capacity toward the right priorities.
Apply Forecast Modeling Based on Past Throughput and Task Complexity
Chrono Platform turns your historical metrics into forecast models. It uses throughput and cycle time data to project how long similar tasks will take given your current delivery rate.
Chrono learns complexity from your past work, so it replaces subjective complexity scoring with data-driven patterns. This makes planning faster and far less idiosyncratic.
Adjust for Current Team Capacity (Chrono Platform Shows Workload and Utilization in Real Time)
Projects shift constantly. People take vacations, onboarding slows teams down, and production incidents steal focus.
So, Chrono Platform tracks these fluctuations automatically by linking work activity to calendar data. You can adjust estimates in real time as team availability changes. That way, you keep your forecasts grounded in current conditions instead of static baselines.
Validate Estimates by Comparing Predicted vs. Actual in Future Sprints (Continuous Calibration)
The real power lies in calibration. Chrono Platform lets you compare predicted timelines with actual delivery across sprints.
You’ll see whether forecasts are improving and which variables (like context switching or scope creep) cause drift. In time, this feedback loop helps your estimates get sharper, your planning cycles shorter, and your confidence higher.
With that out of the way, let’s look at the practices that make estimation consistent across teams.
Best Practices for Software Development Time Estimation
Accurate estimation is a continuous loop of measurement, adjustment, and refinement. But the more real data you use, the less you rely on assumptions. To keep estimates grounded in facts, follow these best practices.
Calibrate Estimates Every Sprint Using Live Metrics
At first glance, estimates lose value fast if they aren’t checked against reality. That’s why reviewing live metrics every sprint helps you see whether delivery pace, scope size, or rework changed outcomes. From there, you can use this data to recalibrate future estimates.
In the long run, these small adjustments steadily reduce drift between planned and actual effort. This is the difference between reactive planning and continuous calibration.
Separate Feature vs. Maintenance Workloads
Treating all work as equal leads to distorted forecasts. In reality, feature work usually follows planned cycles, while maintenance or failure-demand tasks appear without warning. Once you separate the two, capacity forecasts become much clearer.
This separation prevents unplanned work from skewing the cycle times you rely on for forecasting strategic development work. Basically, it makes your estimates more accurate.
Track “Time to Value,” Not Just Time to Complete
Completion doesn’t always equal impact. In many cases, measuring how long it takes from idea to measurable value (whether a customer release or internal gain) gives a truer view of delivery efficiency.
After all, a short “time to complete” means little if deployment or validation stalls afterward. Focusing on time to value allows you to connect engineering progress directly to business results rather than just output speed.
Avoid Manual Tracking; Rely on Passive Signals for Consistency
Manual timesheets are inconsistent and even inaccurate in many cases. In contrast, passive data signals from work tools provide objective, repeatable insights.
When activity data comes directly from commits, ticket updates, and calendars, you eliminate bias altogether. As a result, measurement stays consistent across teams, regardless of individual reporting habits.
Review Predictability Trends Quarterly to Improve Planning Accuracy
Quarterly reviews show whether your estimation process is improving or slipping. Comparing predicted and actual delivery over several sprints shows long-term patterns.
If predictability starts to fall, it’s a sign to revisit how work is sized, prioritized, or interrupted. So, you can use those insights to make steady, structured adjustments instead of quick fixes.
Remember: Accurate estimation comes from iteration. So, let’s see how Chrono Platform ties these best practices together to transform planning and forecasting across your teams.
Estimate Software Development Time With Chrono Platform
At Chrono Platform, we’ve built a system that replaces guesswork with proof. Every feature is designed to help you estimate delivery time with precision, connect forecasts to real data, and reduce the hidden effort that slows teams down. Here’s how we make that possible.
Automated, AI-Powered Time Tracking
Our platform captures time automatically from tools your teams already use, such as Jira, GitHub, Google Calendar, Outlook, and Slack. There’s no manual entry, and therefore, no disruption to developer flow.
We collect activity signals such as commits, ticket updates, and meeting events to reconstruct an accurate record of engineering effort. Because the process runs in the background, it removes bias and gives you the truth about where time actually goes.
Real-Time Risk Forecasting
We identify delivery risks before they turn into missed deadlines. Our forecasting engine analyzes throughput patterns, workload imbalances, and context-switching trends as they happen.
When a sprint starts drifting, you can see it early, instead of during the post-mortem. This visibility lets you adjust priorities or capacity in real time to keep your projects aligned with expectations.
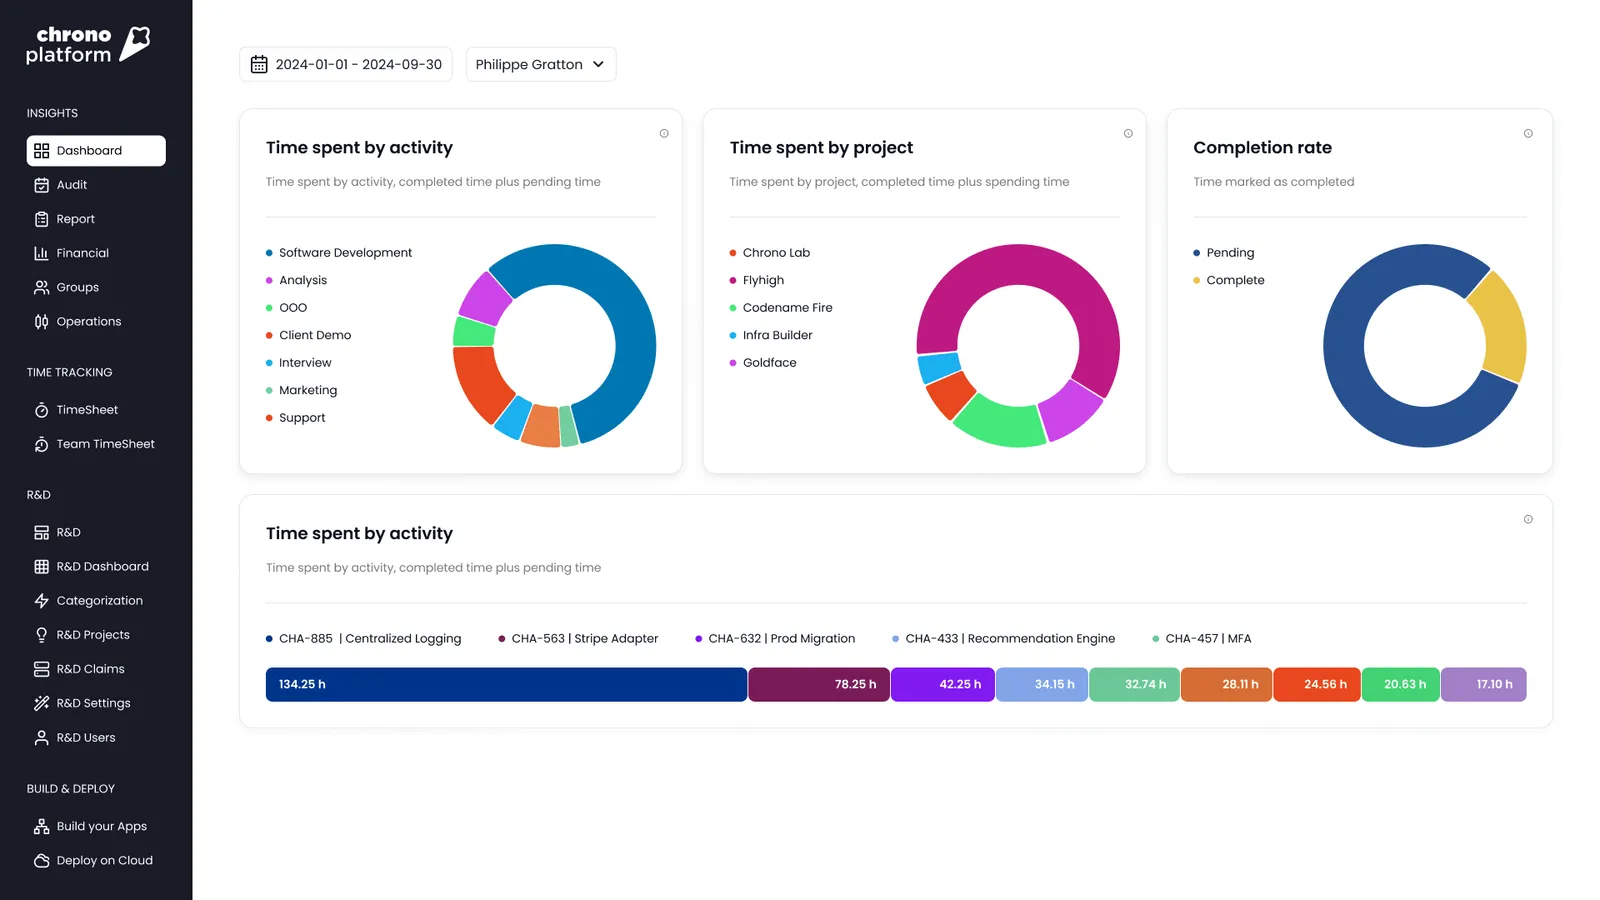
Engineering Metrics Dashboard
Chrono Platform centralizes the metrics that define delivery health, such as velocity, predictability, and capacity. The dashboard shows what’s on track, what’s lagging, and why.
Instead of jumping between spreadsheets or dashboards, you get one connected view of engineering performance. It helps you make decisions faster and back them up with evidence your leadership team can trust.
R&D Tax Credit Compliance
Our time reconstruction model supports audit-ready R&D reporting. Every tracked signal (from commits to calendar events) links back to verifiable project data. This structure means your engineering activity aligns seamlessly with SR&ED and other tax credit requirements. It can save you hours of manual documentation.

FinOps Integration (For DevOps Teams)
We bridge engineering output with financial reality. Chrono Platform connects time data with cost forecasting tools so you can understand the budget impact of delivery trends. This alignment helps FinOps teams translate engineering velocity into predictable financial outcomes.
At Chrono Platform, we help you replace assumptions with verified data and plan with confidence. If you want forecasting that reflects reality, contact us today to see how Chrono Platform can redefine your estimation process.
FAQ
What is the best way to estimate software development time?
The best way to estimate software development time is by using real-time data instead of static assumptions. Historical performance and live metrics create forecasts grounded in actual delivery patterns. This approach reduces bias and aligns your estimates with how your teams truly work.
How do real-time engineering metrics improve forecasting accuracy?
Real-time metrics improve forecasting accuracy by reflecting current team capacity, workload, and flow efficiency. They allow you to adjust predictions as delivery conditions change. As a result, you plan based on facts rather than outdated baselines.
What are common mistakes in software time estimation?
Common mistakes include relying on manual inputs, ignoring context switching, and overlooking non-project work. These gaps create unrealistic delivery targets. Replacing assumptions with automated data closes those gaps.
How can AI automate software project estimation?
AI automates estimation by analyzing signals from connected tools like Jira, Git, and calendars. It detects trends, classifies work types, and models delivery times based on past performance. This removes subjective estimation from the planning process.
How does Chrono Platform help with time tracking and forecasting?
Chrono Platform captures data automatically and reconstructs accurate engineering timelines. It categorizes time across features, maintenance, and meetings. This gives you a full picture of team effort. With this visibility, your forecasts become precise, consistent, and audit-ready.