Engineering Executive’s Guide to Agile Team Metrics: Velocity, Load, and Planning Explained
Master Agile velocity, load & planning metrics with this executive guide.

You’re leading a growing team, juggling delivery goals, budget constraints, and burnout risks, all while trying to keep the business moving forward. But how do you know if your team’s current pace is healthy? Or if you’re setting them up for long-term success?
That’s where Agile Team metrics for engineering leaders step in. While these metrics give you numbers to work with, they also help you see patterns, spot gaps, and plan smarter.
In this article, you’ll learn the most useful Agile Team metrics, how they work together, and how you can use them to keep your team steady, productive, and aligned.
Keep reading below.
What Are Agile Team Metrics?
Agile team metrics help you understand how your team delivers work because you can track progress, spot bottlenecks, and improve predictability. These metrics support better decisions around team allocation, timelines, and process improvement.
With Agile engineering metrics, you’ll stop guessing how much your team can handle. Instead, you’ll be working with real data that reflects your team’s actual limits and strengths.
That said, the next step is to understand which metrics give you the clearest view of your team’s load.
3 Key Agile Team Metrics for Engineering Health and Delivery Planning
To manage your team’s health and delivery planning in an Agile environment, you need the right mix of metrics. These metrics help you balance speed, focus, and sustainable pace, so you can make smarter calls about priorities, resourcing, and process improvements.
Here are the most useful ones to keep an eye on:
- Velocity: Measures how fast work is completed over time. You can pair it with cycle time to track the speed of work through different stages.
- Engineering load: Looks at how much work is assigned compared to what your team can realistically do. You can also keep an eye on Work in Progress (WIP) to avoid overload.
- Planning: Planning-related metrics track how well your team’s time and effort are organized, and they include:
- Developer utilization/time allocation: Shows how each developer’s time is divided across tasks, meetings, and deep work. Helps identify context-switching and underused capacity.
- Team allocation across initiatives: Tracks how your team’s effort is split between projects or priorities. Too much spread = slower progress and less focus.
- Developer availability: Measures how much actual time devs have to contribute, factoring in PTO, meetings, and non-project work. Crucial for realistic sprint planning.
We’ll explain these three metrics in more detail below. For now, let’s admit that it’s also important how you track these capacity metrics so you can stay in control and plan smart.
Spreadsheets have their place, but they don’t scale well. ColabSoftware found that close to 64% of teams still rely on massive spreadsheets for design reviews. Things get worse when these spreadsheets become packed with hundreds of rows, broken formulas, and dashboards nobody really trusts.
At the same time, teams are clearly searching for better answers. According to CloudBees, 92% of engineering leaders use at least one DevOps platform to track performance, and nearly 70% use more than one. The takeaway is most haven’t found a tool that truly fits yet.
That’s why later in the article, we’ll discuss the best software for the job. You’ll also see how these metrics work together to give you a clearer picture of your team’s performance.
Now that you’ve seen what to track, let’s talk about why any of this really matters, and what kind of impact these insights can actually make.
Why Follow the 3 Key Agile Team Metrics Above
You’re making decisions every day that affect delivery timelines, team health, and budget performance. When you track the right Agile team metrics, you gain the insights you need to make smart moves before problems grow.
Here are the top reasons why these metrics matter so much.
Align Engineering Investment With Business Needs
If you don’t know how your engineering time is spent, it’s nearly impossible to match your budget to what actually drives value. These 3 Agile team metrics show you where effort goes, so you can make sure your biggest projects get the right level of support.
You can also stop overloading your high performers and start aligning engineering hours with what matters to the business. That helps you prove ROI and makes planning conversations with finance a whole lot easier.
Improve Delivery Forecasting and Predictability
Everyone wants to know when the work will be done. But if your forecasts are built on guesses or inflated velocity, those delivery dates won’t hold up. When you build your plans using real capacity data, you get much closer to reality.
That means fewer last-minute shifts, fewer missed deadlines, and more confidence across your team. In fact, Agile teams that use capacity planning see up to 25% higher productivity, 40% fewer delays, and even 75% cost savings.
Prevent Developer Burnout and Turnover
Overloaded teams might deliver in the short term, but the damage builds up. Burned-out developers are more likely to call in sick, quit, or mentally check out. Studies show they’re 63% more likely to take a sick day and more than twice as likely to be looking for another job.
Even if they stay, they lose confidence and stop engaging with their manager. Tracking engineering load helps you catch the warning signs early, before good people walk out the door.
Optimize Team Allocation and Resourcing
You probably have a mix of urgent projects, long-term bets, and internal maintenance. But without clear visibility, work piles up unevenly. Following velocity, load, and planning-related metrics help you balance effort across teams and adjust based on what’s needed now.
You’ll know when to shift resources, when to hire, and when to slow down. It’s the best way to make sure you’re not leaving any team stretched thin or underused.
Increase Cross-Functional Transparency and Trust
Business leaders want to know what engineering is doing and why timelines shift. When you share clear, data-backed insights, it builds trust.
You stop hearing “Why can’t this be done faster?” and start having honest, productive conversations about tradeoffs. You don’t need to promise the impossible, but you do need to show what’s possible based on actual team capacity.
Now that you know why these metrics matter, let’s break down the most important ones you should be using in your day-to-day decisions.
Velocity, Load, and Planning Explained
To lead with confidence, you need a clear view of how your team is performing, where they’re stretched, and how your plans line up with reality. That’s exactly what these metrics are built for. Here are the ones that give you the sharpest picture of your team’s actual capacity and help you stay in control.
Velocity
Velocity tells you how much work your team delivers within a set timeframe, like a sprint or a week. You can measure it in story points, tasks, or other units tied to the value delivered. It’s a snapshot of output (what actually got done).
This metric helps you set a sustainable pace. If velocity stays steady, your team likely has the right balance of workload and support. When it drops, that can mean blockers, team changes, or unclear goals. Big swings in velocity across sprints signal instability, which makes it harder to plan and commit to timelines.
The best teams track velocity alongside related metrics like deployment frequency, lead time, throughput, and MTTR (mean time to recovery).
So, how fast are development teams really?
According to the 2024 State of DevOps Report, elite teams usually ship code multiple times per day, maintain change failure rates at 5%, and fix issues in under an hour.
But before you start worrying too much about your own team, remember this. What matters most isn’t the number itself, but the trend. You want to see steady or improving velocity with low variance, and that’s what tells you your team is stable and maturing.
If you’re trying to improve your team’s velocity, start by removing blockers, getting better at estimating effort, and making your team composition more stable. Sometimes, just adding clarity around goals can do wonders for consistency.
Engineering Load
Engineering load tracks how much work your team is assigned compared to how much they can realistically handle. This means keeping their workload balanced so they’re not stretched too thin or left idle.
A healthy load means your team can finish what they start without rushing or burning out. If load keeps creeping above your actual velocity, it’s a red flag. It means you’re asking too much. Other signals of overload include rising work in progress, more task switching, and an increase in unplanned work.
Benchmarks show that high-performing teams operate best when their planned load lands between 85% and 115% of their actual capacity. A capacity accuracy score below 80% means your planning is off or work is being blocked. One above 115% means you're consistently planning more work than your team can realistically deliver. While it might look like you're aiming high, it more likely signals chronic overcommitment.
According to the same research, planning accuracy should also stay between 75% and 96%. If you’re seeing 95% accuracy but your team is still underused, it might mean the work isn’t challenging enough or there’s too much buffer built in.
To fix load issues, you can start by redistributing work across your team, cutting or deferring low-priority items, and being more realistic about capacity. It also helps to block out time for support, meetings, or context shifts.
In fact, Anton Weiss, software delivery optimization expert and DevOpsShorts host, suggests reserving around 30% of capacity for support work and 20% for learning to keep things sustainable.
Capacity Planning
Capacity planning involves aligning your team’s time and skills with the business's actual needs. It helps you make sure the right people are working on the right things at the right time. Good planning keeps you on schedule, avoids staffing mismatches, and helps align engineering with business priorities.
Your capacity plan should clearly show forecasted demand next to actual available capacity. If you're constantly missing those targets, it’s usually a sign that something’s off with your estimates or that work is slipping in untracked. Missed plans create pressure, drive overtime, and damage trust across teams.
Normally, you should never plan for your team to work at 100%. People need time to think, talk, take breaks, and deal with the unexpected. Aim for around 80% utilization as a baseline. If your team is working on unfamiliar tasks or using new tools, 60% to 70% might be more realistic. You want to leave space for learning and recovery.
To improve your capacity planning, involve your team in the process. They know their pace better than anyone. Use your historical data (velocity and load) to guide your assumptions, and build in time for unplanned work and meetings. You’ll make better calls and get fewer surprises.
Supporting Metrics: Time, Team, and Availability
To sharpen your capacity planning even more, you should track supporting metrics that reveal how your team’s time is spent and how it’s split across priorities.
- Time allocation shows you how much effort goes into roadmap work, support, or internal tasks.
- Team allocation helps you see if initiatives are properly staffed or spread too thin.
- Availability tells you who’s actually free to take on work, factoring in vacations, meetings, and part-time schedules.
These inputs give your plan more accuracy and help you spot conflicts early, before they impact delivery.
Engineering Capacity Planning Best Practices
Planning only works if you keep it grounded in what your team can actually do. That’s why engineering capacity planning isn’t only about headcount or deadlines, but about working smarter, not harder. To help you stay on track, here are the most practical capacity planning best practices you can put to work.
Balance Demand With Sustainable Capacity
You might feel pressure to keep your team running at full speed, but, as we noticed above, staying at 100% capacity is a fast track to burnout. When there’s no room to shift, your team can’t handle surprises, and small issues turn into big ones.
Overloaded teams get tired, turnover rises, and projects slip through the cracks. Hence, you should give your team room to breathe by planning for a pace they can maintain, not just survive.
Account for Maintenance and Unplanned Work
You already know bugs, support issues, and tech debt don’t go away just because roadmap work is more exciting. If you don’t plan for these, you’ll pay for it later in missed goals or mounting issues.
On average, companies dedicate 15-20% of engineering capacity to technical debt and related work. Build that into your planning upfront so you’re not constantly stealing time from your future self.
Use Data to Drive Hiring and Resourcing Decisions
Hiring based on gut feeling puts you at risk of overspending or missing deadlines. Instead, let velocity and engineering load trends guide your decisions. If your team’s output stays flat while demand rises, it might be time to add headcount.
On the other hand, if you’re consistently under capacity, you should hold off instead. 34% of tech roles were marked as extremely difficult to fill in 2024, so start planning resourcing early.
Continuously Monitor and Adjust Capacity Plans
Engineering capacity management isn’t a one-time activity. Projects shift, priorities change, people get sick, and teams grow. That’s why you need to check your capacity plans regularly against actual results.
We believe that you should watch for signs such as missed sprint goals or rising unplanned work. Adjust timelines or resources before things get out of control.
Communicate Capacity and Tradeoffs Clearly With Business Stakeholders
When you manage engineers, you also manage expectations. So, don’t forget to be upfront with business leaders about what your team can realistically take on. At Chrono, we would advise you to show them the data and even talk through what gets delayed when new work is added. This helps prevent misunderstandings and keeps everyone focused on outcomes, not just on the effort.
Smart engineering capacity planning helps you stay flexible, protect your team, and hit your targets. These capacity planning best practices will keep your plans honest and your projects moving forward. Use them as a checklist and part of your regular engineering capacity management routine.
To actually manage all of this without drowning in spreadsheets, you’ll need the right tools. So, let’s talk about that for a minute…
Best Tools for Engineering Load Management
If you're trying to manage engineering load without the right tools, you're probably stuck piecing things together across calendars, spreadsheets, and siloed dashboards. That approach wastes your time and leaves you guessing.
Instead, you need a clear, real-time view of how your team is working. Here are the key tools built into Chrono Platform that help you do exactly that.
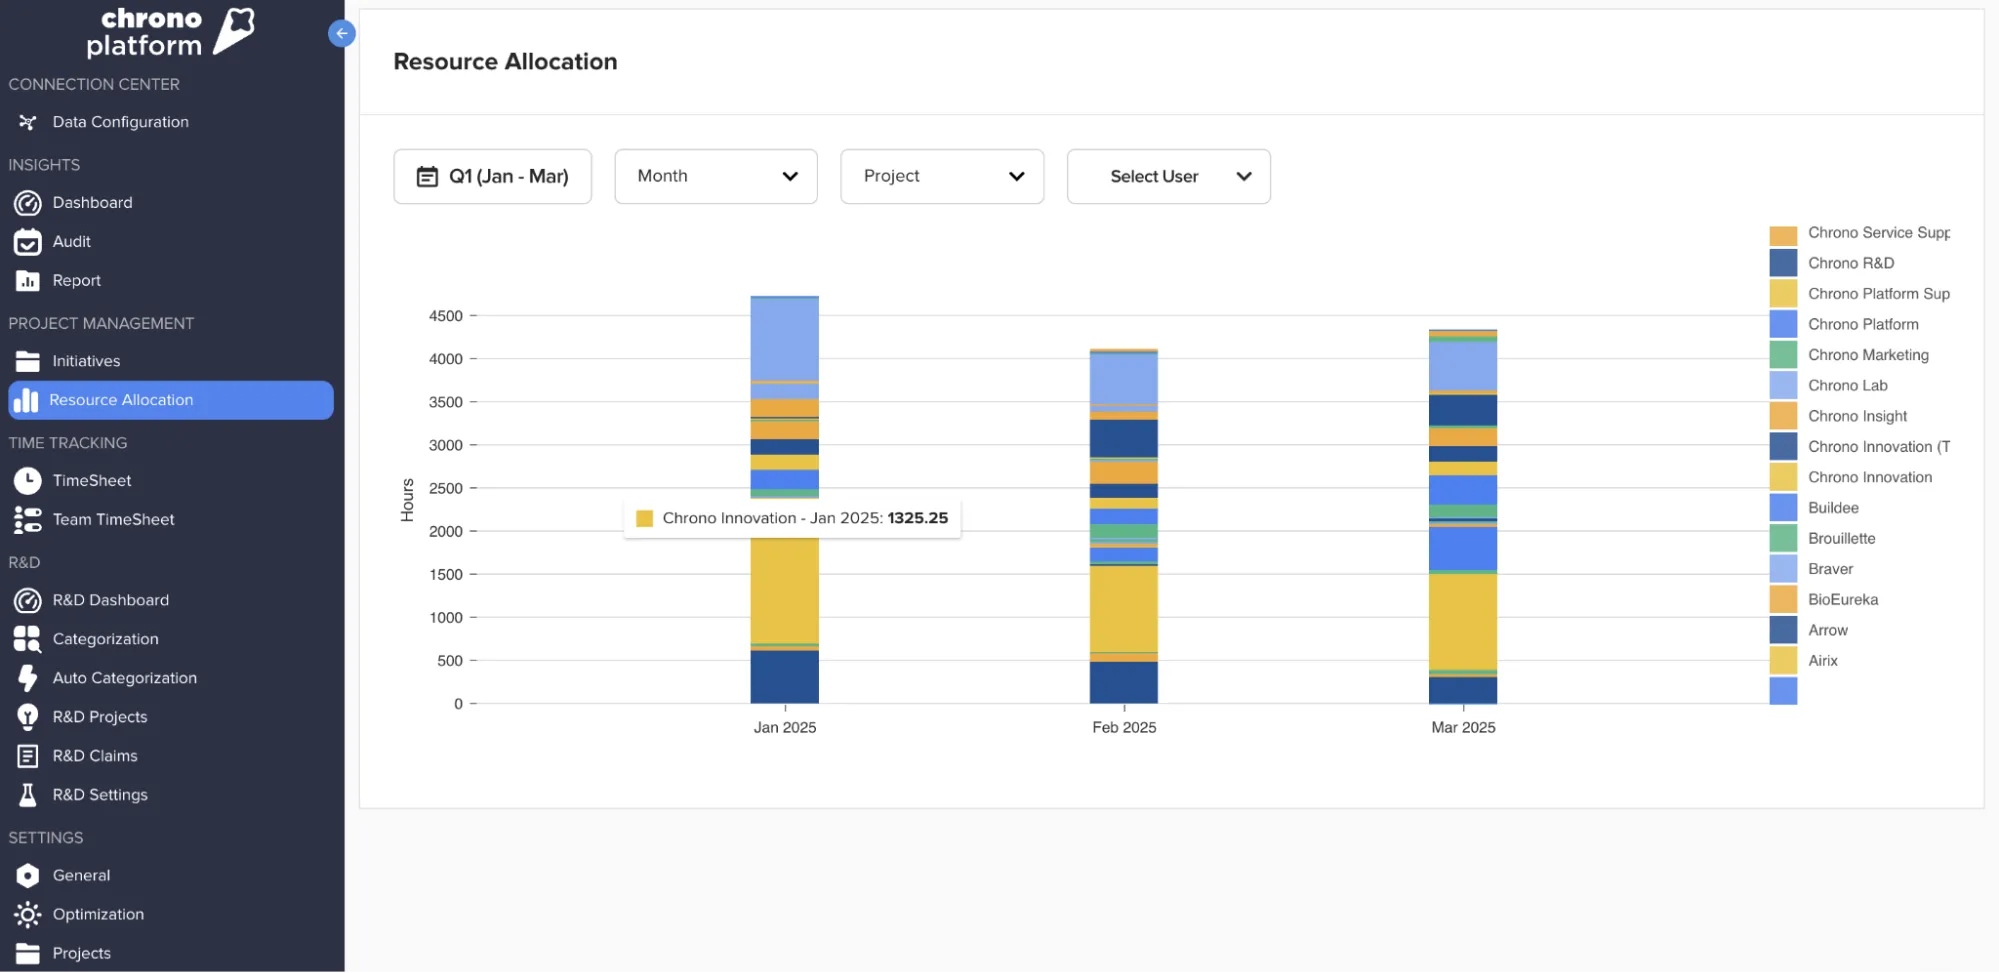
Resource Allocation Tool
Resource allocation gives you a full breakdown of how each team member’s time is spread across projects and activity types.
Whether you’re planning the next sprint or reviewing the past quarter, you can filter data by timeframe, role, or task type. You’ll instantly spot if someone’s overloaded, underused, or stuck in the wrong work.
The best thing of all is that you’ll remove the guesswork and get clean, clear allocation data.
Automated Time Tracking & Categorization Tool
Forget chasing people for timesheets. With the Time Tracking Tool, Chrono pulls data automatically from your calendars and Jira. Then it tags tasks by type, such as development, design, marketing, or anything else.
If the platform gets something wrong, you can reclassify it in seconds. This gives you reliable insight into where your team’s time actually goes.
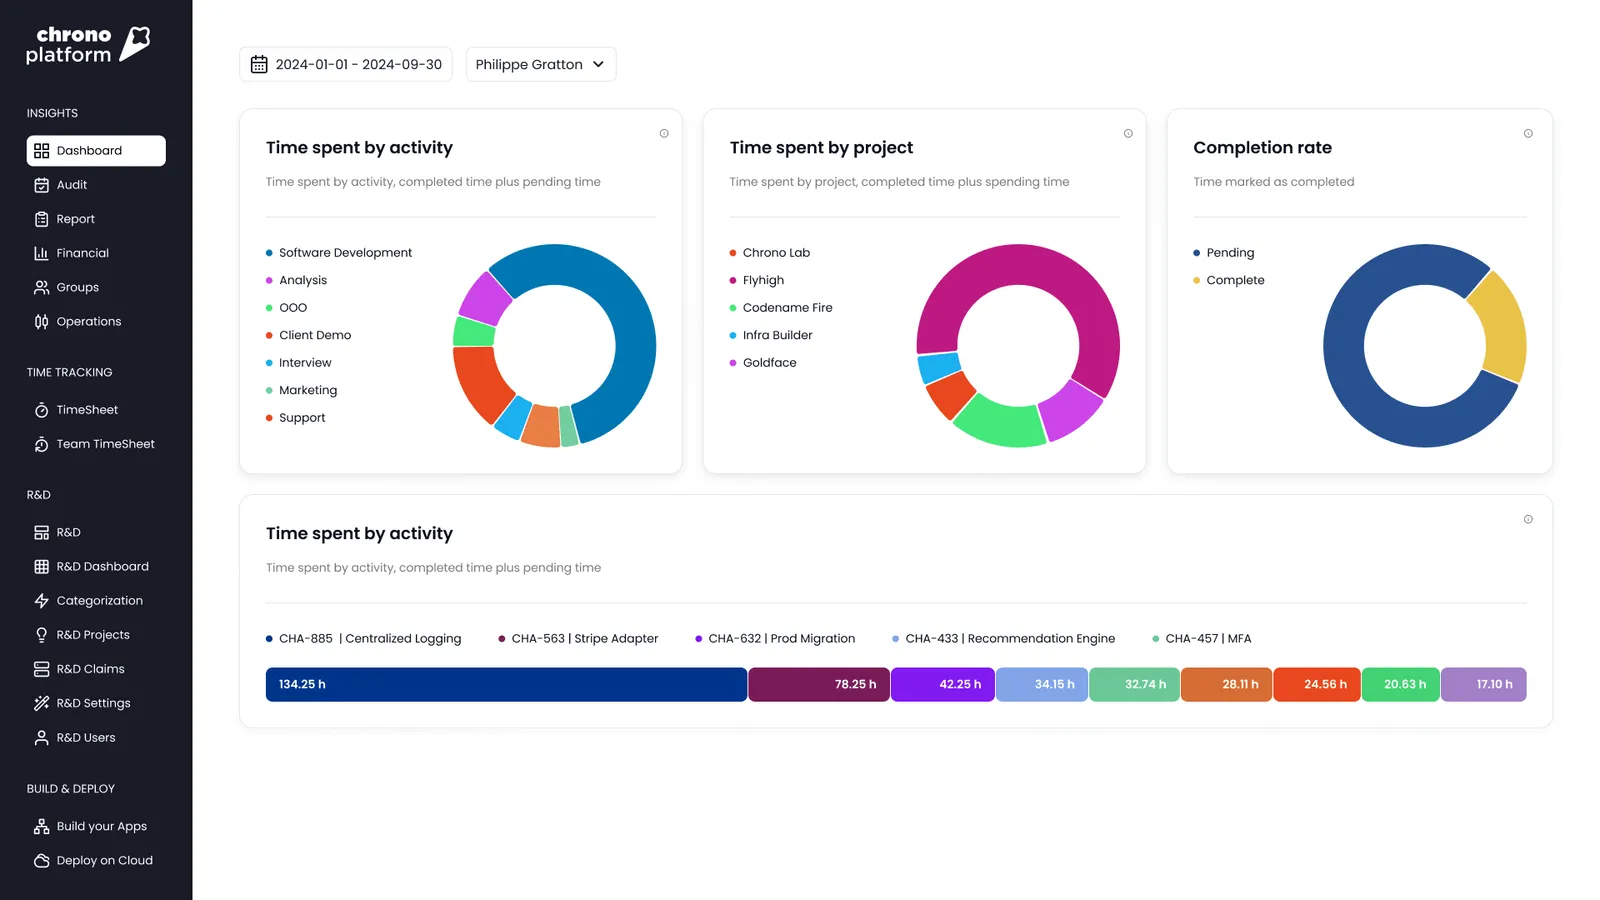
Financial Tracking Tool
A Financial Tracking Tool connects engineering activities with actual dollars. You can see how much you're spending per project, track against budget, and check whether the time spent is delivering value.
You’ll also catch cost overruns early and spot where money’s being wasted. It's a solid way to link engineering work with business performance.
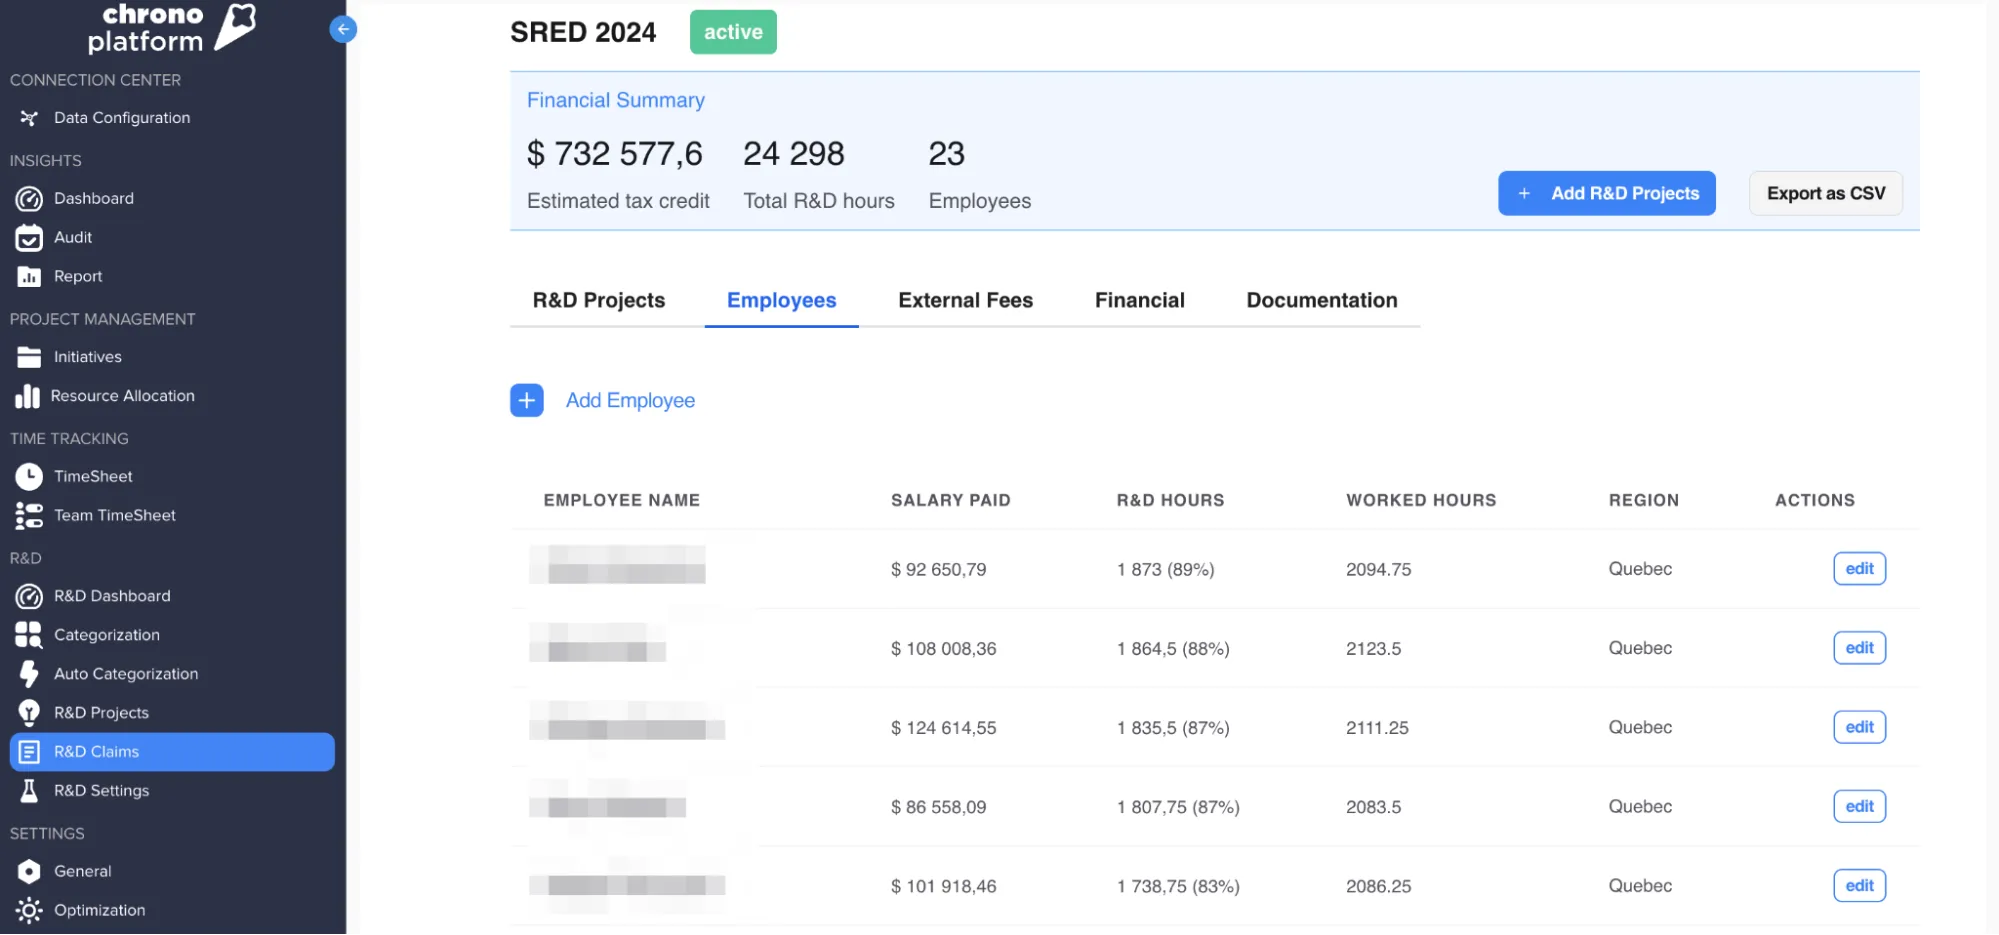
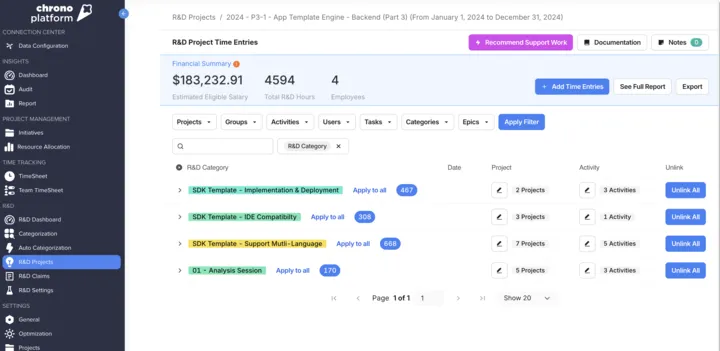
R&D Claims Management Tool
R&D tax credits can be a goldmine if you track them right. Chrono automatically sorts eligible vs. non-eligible hours based on project type and task details.
Our R&D Tax Credit Dashboard even forecasts your future claims and gives you ready-to-export reports. That means less time spent on audits, fewer errors in filings, and faster access to reclaimed budget. And more reclaimed budget.
Team Activity Monitoring Tool
Want to know if your team’s on track? This tool shows code commits, issues resolved, and time per task, broken down by person or team. You’ll spot trends, identify slowdowns, and know whether your sprint goals are realistic or off the mark.
Risk Detection & Planning Tool
This tool flags problems before they snowball. You’ll see alerts when projects slip, teams get stretched too thin, or budgets go sideways. The goal is to plan ahead with confidence. Real-time signals help you stay ahead of risks without scrambling at the last minute.
Every one of these tools is built to help you manage engineering load with precision. You don’t need to rip out Jira or redo your entire stack. With Chrono, you get a layer of insight that brings all your data together and helps you lead with clarity.
Make Capacity Planning Your Competitive Edge
Using these Agile team metrics and tools can help you deliver work on time, protect your team, and support smarter growth. When you see how time is spent and where resources go, you can stop relying on gut instinct and start making decisions backed by real data. The result of this is better forecasts, stronger team health, and fewer surprises for the business.
If you're serious about improving visibility and turning engineering into a strategic driver, now is the time to make the shift. Try Chrono Platform for free and start leading with insights that actually move the needle.